
My Systematic Trading Update: The Good, the Honest, and 75% YTD
**Disclaimer: Quant Science is not a registered investment adviser under the Investment Advisers Act or a commodity trading advisor under the Commodity Exchange Act. The information provided is for educational and informational purposes only and does not constitute investment, financial, or trading advice.
**Disclosure: This post contains affiliate links. As an affiliate of Quant Science, I may receive a commission if you sign up or make a purchase using my links, at no additional cost to you. All opinions expressed are my own and based on my personal experience.
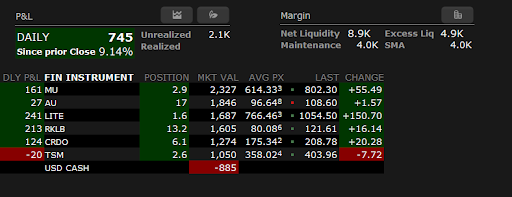
I’m up 75% YTD, and I’m about to deposit more money into my trading account. I wanted to share my results now, because once I add capital, I won’t have a clean chart to show anymore. The 75% is driven heavily by recent gains by LITE, RKLB, and MU, and this has been a particularly lucky month. I’ve been live since October, survived the Iran War drawdown, and it’s finally time to scale my tiny account a bit. I stayed at $5,000 for the first part of the year because I'm genuinely risk-averse. I wanted to prove the strategy worked in live conditions before I trusted it with more money. The other small account pictured below is where I’m running a crack spread strategy, but I’ll save that for another article. You can see that this screenshot was taken on an outlier of a day. I don’t want to pretend that it looks like this all the time, it doesn’t. This is around the 1-year anniversary of when I started learning algorithmic trading, I wanted to share what I’ve learned and save this as my own personal journal as well.
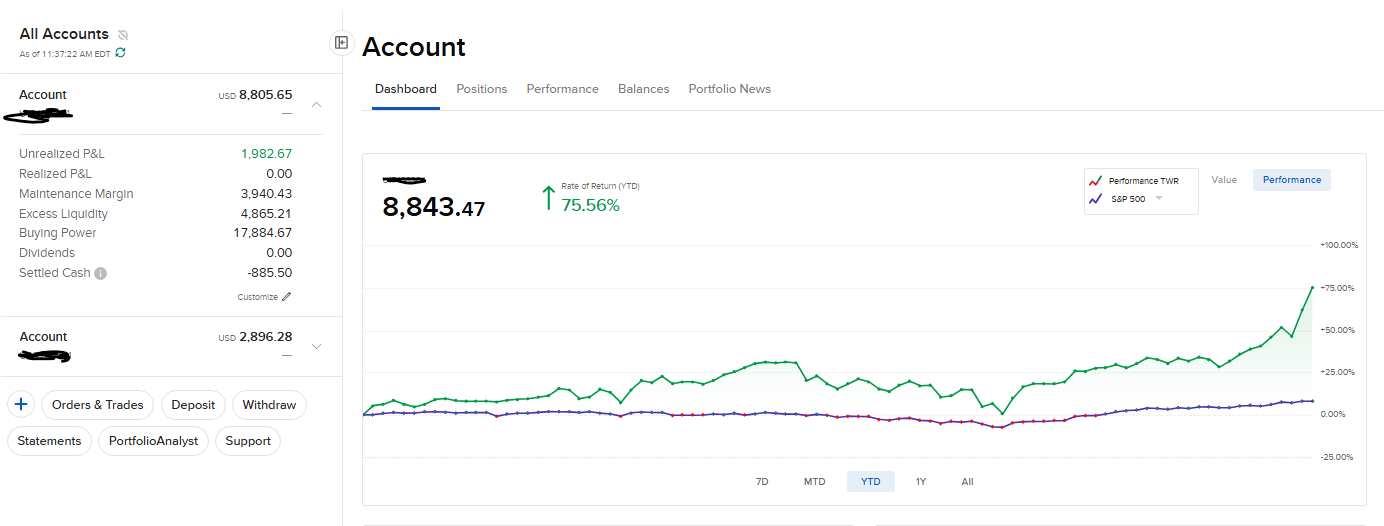
Picture above: My IBKR account - 75% YTD.
Picture below: It just happened to be a great day when I wrote this article - a pretty outlier.
In this article I'll cover:
Backstory
What the Quant Science program has taught me and where I've taken it further
How the Iran war drawdown impacted my portfolio and what staying systematic through it actually felt like
The honest stuff: what I'm still doing manually that should be automated
About the Quant Science Program
Backstory
The backstory is that I originally signed up for the Quant Science courses in April 2025. I went live with $850 in October, traded with $1,800 in November, and then scaled to $5,000 in December. On January 1st, I had $5,037 in the account. I had gains each of the previous months, but with a tiny account, the data subscription fees (unsurprisingly) ate most of my modest gains.
If you haven’t been following, the strategy I’m trading is an XGBoost-based momentum model that rebalances monthly, built on the Quant Science framework and then further extended with my own features and filters. This is an honest look at how I got to this point and where things stand.
What I've Learned
The Quant Science program gave me a foundation I could not have built on my own in any reasonable timeframe. The infrastructure alone, Prefect for orchestration, MLflow for experiment tracking, Zipline for backtesting, would have taken me a ton of time to build from scratch, and I would have struggled hard. It did take me some time to get set up and understand the metrics that matter, but I was able to get to the backtesting and analyzing phase pretty quickly.
Going live is humbling in ways backtesting doesn’t prepare you for. I've agonized over whether to correct an error I’ve noticed mid month. I've gotten a bad fill and spent way too long thinking about limit orders vs. market orders, knowing every single one of my backtests used market orders.
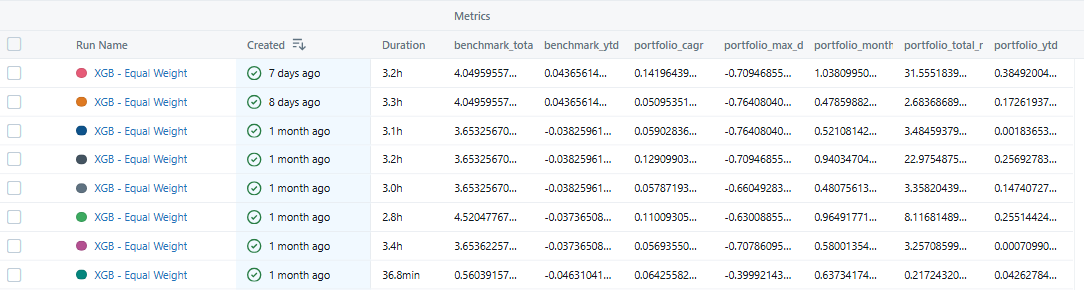
I’ve experimented with multiple features to try and pick up regime changes more quickly, I’ve tried different ways of weighting picks based on momentum or prediction scores, and I’ve endlessly tweaked a momentum quality layer that gates entries based on MACD, RSI, and ROC thresholds. Testing everything one variable change at a time and then testing each interaction. There’s been so many backtests. I should be changing the run name with each experiment. I'm not. I mostly identify tests by duration, CAGR, and drawdown.
Backtesting follows the system perfectly. Live trading is messier. One month, I used the wrong version of the model to make my picks and didn’t figure it out until almost a week into the month. I have had rebalance days where I was traveling and had to trade ahead of the 1st of the month. Between human error and life, I’ll never be as perfect at executing the system as my backtests. I’ve also learned that it can be ok.
The Iran War Drawdown
End of February through the beginning of April, my portfolio dropped 29%. The catalyst was the Iran war and the volatility that came with it. My positions were concentrated in AI infrastructure and precious metals miners, two sectors that got hit hard when geopolitical risk spiked and institutions started de-risking broadly. There was no model failure. The strategy was doing exactly what it was designed to do, holding momentum positions through a monthly rebalance cycle. I did not intervene. I promised myself that I’d wait for the next rebalance date. Trying not to intervene felt like being the captain of a sinking ship. I had conversations with myself that went something like “I’m just going to ride this down and cross my fingers”. The portfolio recovered. That experience taught me more about systematic vs. discretionary decision-making than any backtest ever could. It’s likely a big part of why I’m ready to add more money to the account.
I'll be honest, even with a small account, I can sometimes stare at my monitor on down days. The discipline required to not intervene can be tough when your daily P&L isn’t pretty, but after watching it for a couple of months, I’ve learned that a lot of times (outside of bigger geopolitical events) it goes down and then comes back the next day. This has been one of my biggest lessons going live.
What I'm still doing manually that I shouldn't be
I still execute my trades manually. I’m not sure if I’m embarrassed about it. Every month, the model runs, generates picks with their scores, and tells me what to buy, hold, and sell. The automation infrastructure is there, I just don’t use it.
I review the metrics and charts before placing trades, and every once in a while I’ll get a pick that looks wonky, and I cut it. I know that’s not very systematic of me. It feels like a vulnerable thing to admit. I’ve been thinking about what I could add to the model or filters so I’d feel more comfortable fully automating.
There are a few other things I track manually that should be automated by now, including performance logging. I’ve built a dashboard for this twice. I’ll be happy with it for a month, then realize I want to see things differently, and never touch it again.
About the Quant Science Program
The Quant Science program is two courses that build on each other. Level 1 gives you three core strategies out of the gate — momentum, risk parity, and crack spread — along with the backtesting framework to evaluate them. You'll work with Zipline and VectorBT for backtesting, and Pyfolio and Alphalens for performance analysis. By the end of Level 1 you have working strategies and the tools to evaluate them properly. I’ve written more about my Level 1 experience here.
Level 2 is where it starts feeling like a real production system. You move from notebooks to modular Python scripts, pull data from Financial Modeling Prep into a DuckDB database, and combine momentum with value and fundamental factors using XGBoost. Prefect handles orchestration so the pipeline runs on a schedule, and MLflow becomes central to tracking and comparing every backtest run. Everything I've described in this article is built on that foundation. Here’s my longer review of Level 2.
If you're considering joining, my affiliate link gets you $1,000 off the course.
To attend the next free live webinar to hear more about the course, you can do that here.
Closing
I’m finally not just learning systematic trading, I’m actually living it. I feel like I’ve seen the system hold up under real pressure, and I’m finally ready to start scaling a bit more.
Next up, I’m taking the Quant Science options course, which hasn’t launched yet. After the drawdowns in March, they sped up their timeline for launching this course that’ll help you hedge your momentum strategy during drawdowns. I’ve tried options before and I typically lose, so I’m looking forward to approaching them systematically. They’re also providing historical options data, which would be a barrier if I had tried to do something like this on my own. I’ll be sure to share more as I get into the options course.
I’ve come a long way from first going live in October. If you’re doing something similar, whether you’re just getting started or already trading, I’d love to hear where you’re at. I’d take all of the trading friends I can get.
**The content in this article is for informational and educational purposes only. It is not intended as financial, investment, or trading advice. All strategies and opinions expressed are those of the author and do not constitute recommendations to buy, sell, or hold any financial instruments. Trading and investing involve risk, and you should conduct your own research or consult a qualified financial advisor before making any investment decisions. Hypothetical or simulated performance results have inherent limitations and do not represent actual trading. No representation is being made that any account will or is likely to achieve profits or losses similar to those shown. Quant Science is not a registered investment adviser or commodity trading advisor, and nothing herein should be construed as personalized advice. **