A Data Scientist’s Journey into Algorithmic Trading with Quant Science
** Disclosure: This post contains affiliate links. As an affiliate of Quant Science, I may receive a commission if you sign up or make a purchase using my links, at no additional cost to you. All opinions expressed are my own and based on my personal experience. **
** Quant Science is not a registered investment adviser under the Investment Advisers Act or a commodity trading advisor under the Commodity Exchange Act. The information provided is for educational and informational purposes only and does not constitute investment, financial, or trading advice. **
As a data scientist, I’ve spent years working with data, mostly for business use cases like customer churn, behavioral segmentation, or creating dashboards. But for a very long time (or at least since 2007), I’ve been itching to actually make algorithmic trading work for me. It has always just felt like that side project that could marry data, potentially a return on my investments, and wouldn’t require scheduling any meetings.
My attempts have never yielded results better than neutral, and I’ve always hesitated to invest in trading courses (of any variety) because it’s hard to know whether someone is legit or if they just make their money from selling courses. Then Matt Dancho (Founder of Business Science) launched a course with Jason Strimpel. I’ve known Matt since 2018, I traveled with him to R Conf one year ago, and I had already taken 4 of his Business Science courses. I was so excited that he was building this program, because I’ve been dying to learn, but wasn’t willing to invest anything more than Coursera money with anyone else. To level set, Jason is the one who has actually taught the majority of the live instruction in this course; he has over 20 years of experience trading.
Matt and Jason’s new program is called Quant Science. I’d say this program is for people who already know their way around Python and have a basic understanding of the markets. The day you sign up, you’re getting access to the Omega private repository and following their tutorial on getting everything set up with Interactive Brokers and to use Omega, and you’ll want to be ready to rock.
If you’ve been following my work, you know I love sharing about what I’m learning and building in public. These articles double as my personal notes for later on when people ask me questions about my experience. This is an affiliate article, but the views and opinions are my honest thoughts on the course. The affiliate link gives you $1,000 off the Quant Science program. At the time of writing this article, the discount is not available anywhere else.
Here, we’ll go through:
What I’ve tried before in trading
What we’ve covered so far in the course (I’m halfway through)
My honest review of the Quant Science Program
How it compares to Business Science Courses
What’s next
What I Tried Before
Before this course, I had dipped my toes into trading with:
2007 - started watching Jim Cramer, did poorly during the housing bubble in 2008, like everyone else, and stepped away.
Got on the Robinhood waiting list in 2013. Picked up a share here and there, maybe only played with $3k. No advanced charting, and you’re dealing with slippage.
In 2000, tried learning technical analysis by reading books. I always felt like I could squint at the chart and find multiple different conclusions, even more so if I considered different time periods.
2022, I tried a triangular arbitrage strategy using R and crypto. Lost a little money due to liquidity issues (I was using small exchanges with lots of coin options).
Somewhere in that history, I also tried learning FOREX.
So I’m not new, but I’m also not seasoned; I’ve been a bit all over the place. For the course, I wish I had a better recollection of what I had learned over the years. I’m currently reading books and leaning on ChatGPT to look up terms, but I appreciate being challenged, and there are plenty of resources available for a quick refresher on the finance side. Personally, I’m glad that we’re diving right in.
In all of my previous attempts, I had never tried backtesting. I'd watched a couple of YouTube videos on the topic, but I wasn’t even sure what I wanted to tweak and test, and the number of library and data options was daunting.
What We’ve Covered So Far in the Course
The Quant Science program currently consists of two different courses (Level 1 and Level 2). As they’ve just launched some new libraries they’ve built to create the Level 2 course. They’re still building this out and bringing everyone along for the ride. At the moment, I’ve just finished Level 1. I’ll be sure to write another article as I journey into Level 2. This is a live program, but you also have access to recordings in case you miss a class or need to review material.
The course starts by having you get set up with Interactive Brokers. IB was their choice because it has robust API access, low latency, fast execution, and they haven’t had problems with people outside the US being able to leverage it. Once you have your Interactive Brokers trading account set up, in the first live clinic, you’ll get three strategies, and you'll start paper trading with those.
Level 1:
3 Core Strategies
Momentum Strategy
Focuses on buying assets that have been trending upward, under the assumption that winners keep winning (at least in the short term). Matt often refers to momentum being the real winner for him. We should get his actual full setup in Level 2.Risk Parity Strategy
Instead of allocating capital equally, this approach balances risk across asset classes.Crack Spread Strategy
A classic commodities arbitrage trade involving crude oil and its refined products (like gasoline and heating oil). It's a great example of a relative value strategy and a taste of institutional-style trading logic.
For example, with the momentum strategy, the provided code downloads a substantial amount of data using Jason and Matt’s proprietary library, “Omega”, scans stocks based on factors such as market capitalization and average volume, calculates the momentum factor, and then executes trades all within one notebook. Level 1 has mainly been provided with notebooks for the lectures, and Level 2 will be provided with scripts. When it’s time to rebalance, the notebook looks at what you’re already holding, divests appropriately, and picks up new stocks based on the momentum calculation. This provides you with the building blocks to combine strategies or use them manually as is.
If you want to start modifying and optimizing strategies, you’ll need to backtest. They cover two methods for backtesting, discussing the pros and cons of two different libraries/methods, and when it makes sense to use them.
Backtesting
In the 2nd Level 1 live clinic, they covered:
Zipline – An event-based backtester originally developed by Quantopian. This was used for both the momentum and risk parity strategies.
VectorBT – A faster and more flexible factor-based backtester, especially suitable for custom metrics and portfolio optimization. Below is a picture from the backtest of the crack spread strategy.

Risk Management and Analysis
In the 3rd Level 1 class, we examined the analysis of the backtest results using the following libraries, and Jason highlighted the key metrics to consider when evaluating different strategies.
Pyfolio – To dig into performance analytics for event-based strategies. The example given was with the risk parity strategy.
Alphalens – For factor-based analysis: How predictive is the signal of a factor? We were given a notebook using alphalens for the momentum strategy.
The exposure to both platforms (Zipline and vectorbt) was helpful; they each have their strengths, and understanding both lets you pick the right tool for the job. I might make a couple videos about how to analyze the plots that come out of pyfolio and alphalens, since I know it’s something I would’ve like to watch myself.
The last 2 live classes were around more advanced backtesting and evaluating an xgboost strategy. I was on vacation during these classes and still need to take a deeper look at these. I’m really just documenting my experience as I go along, and this is as far as I’ve gotten right now.
How It Compares to Business Science Courses
I’ve also taken courses from Business Science (which I loved), but Quant Science is quite different. The thing with live courses is that once you sign up, you have to wait a couple of weeks to start. Quant Science hops right into it. In the first lecture, you’re looking at different strategies. In a Business Science course, it’s very project-based, but you’re covering the building blocks much more slowly. I love both, but the prerequisites and how the courses are run is different. The Quant Science Discord for students is quite active, and all of the questions are answered pretty quickly by Jason and Matt.
Quant Science assumes a higher comfort level with code, I’m probably troubleshooting things outside the course and testing things independently more than I would if I were following along with a Python course.
What’s Next:
I’ve come away with reusable templates and new frameworks for thinking about strategy evaluation, and I’m now set up to keep iterating. I’ll be starting Level 2 soon. In Level 2, it’s much about about getting to a full production system utilizing tools like Luigi, MLFlow, and prefect.
Currently, I’ve placed a ton of FMP data in a duckdb database (they give you a discount on a data subscription, but that’s a little over $30/month), and I’m ready to get started with Level 2. I literally just downloaded the data for Level 2, I haven’t looked at it yet.
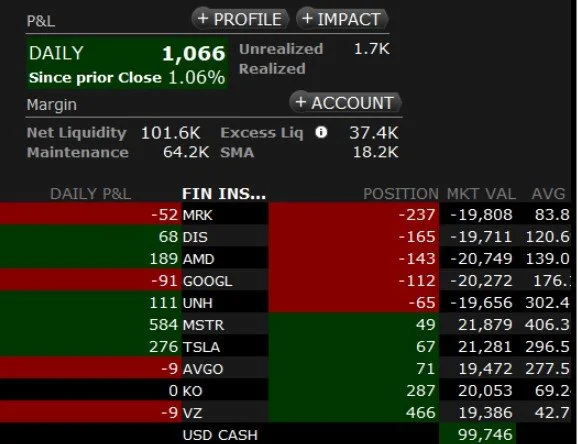
I’m still paper trading. My results? I haven’t really had a chance to see any yet. I’ve been rebalancing and switching strategies so much that I wouldn’t really expect any positive results. I plan to keep sharing as I go along, so definitely join me on this journey. I’m posting a picture of my paper trading account so I can track and share everything.
If you’re interested in joining, I look forward to seeing you in the Discord. After the course ends, previous cohorts stay in the Discord for support, community, and to receive the latest updates. I’m pumped so far. Again, this link gives you $1,000 off of the price of the course and is not yet offered anywhere else: Quant Science Program
If you’re interested in following my progress through the course or my results as I work through it, sign up for my email list. The only emails you’ll receive will be related to algorithmic trading.
Thank you so much for reading! Let me know if this was helpful, you can always find me on LinkedIn.
The content in this article is for informational and educational purposes only. It is not intended as financial, investment, or trading advice. All strategies and opinions expressed are those of the author and do not constitute recommendations to buy, sell, or hold any financial instruments. Trading and investing involve risk, and you should conduct your own research or consult a qualified financial advisor before making any investment decisions. ** Hypothetical or simulated performance results have inherent limitations and do not represent actual trading. No representation is being made that any account will or is likely to achieve profits or losses similar to those shown. Quant Science is not a registered investment adviser or commodity trading advisor, and nothing herein should be construed as personalized advice. **