
The Moment My Trading Went From Demo to Professional (Quant Science Level 2 Review)
**Disclaimer: Quant Science is not a registered investment adviser under the Investment Advisers Act or a commodity trading advisor under the Commodity Exchange Act. The information provided is for educational and informational purposes only and does not constitute investment, financial, or trading advice.
**Disclosure: This post contains affiliate links. As an affiliate of Quant Science, I may receive a commission if you sign up or make a purchase using my links, at no additional cost to you. All opinions expressed are my own and based on my personal experience.
I just finished the Quant Science program, and now I’m testing strategies end-to-end. This is exactly where I wanted to get to, and I can’t imagine how long it would’ve taken me on my own. The Level 2 course is where things feel less like a guided demo, and you move to a professional automated trading workflow. We transitioned from notebooks to scripts, integrating new tools such as Quant Science’s qsconnect, qsresearch, and qsautomate, and also started using Prefect and MLflow in our process.
Here’s what I’ll cover in this article:
What changes in Level 2 compared to Level 1
Getting and managing a larger dataset with FMP
Screening the universe with qsconnect
Combining value and momentum factors in strategies with qsresearch
Using MLflow to track and compare backtests
Orchestrating and deploying strategies
My thoughts so far
What Changes in Level 2
In Level 1, we mostly worked with a smaller universe and jupyter notebooks. Strategies like momentum, risk parity, and crack spread were introduced with all the heavy lifting already built in and it was great to be able to start playing immediately after class. If you’re interested in reading more about Level 1, I’ve shared an article here.
In Level 2, we’re still given the code, but you’re building out something much more professional feeling:
We’re pulling raw data from Financial Modeling Prep (FMP) instead of working with yfinance. FMP is more robust, with cleaner, broader coverage and an official API. As part of the course, Jason and Matt at Quant Science have worked out a discount with FMP, and I’m currently paying $30/month.
You’re screening a larger universe (leveraging that FMP data), often thousands of tickers, and we also start incorporating fundamental data in our strategy. The bigger volume of data gives you the ability to prove your strategy works across diverse market conditions and sectors, increases your sample size for backtesting, helps you create better factors, reduces survivorship bias, and gives you more ability to find better stock candidates for trading.
The workflow shifts from notebook experiments to modular Python scripts. Throughout the course, we’re moving from tinkering to automation.
Backtesting becomes more rigorous, and MLflow becomes a central tool for tracking, organizing, and comparing results. I’ve always loved experiment tracking, and I wrote another article about how the course is using MLFlow (even when there’s no ML involved) and the metrics we’re tracking. You can find that article here.
It feels like moving from that cool POC you worked on for a couple of weeks to being ready to put a real model in production. And it is. These are the Quant Science libraries we’re working with. In the last class, we were introduced to qsautomate, which orchestrates the whole pipeline.
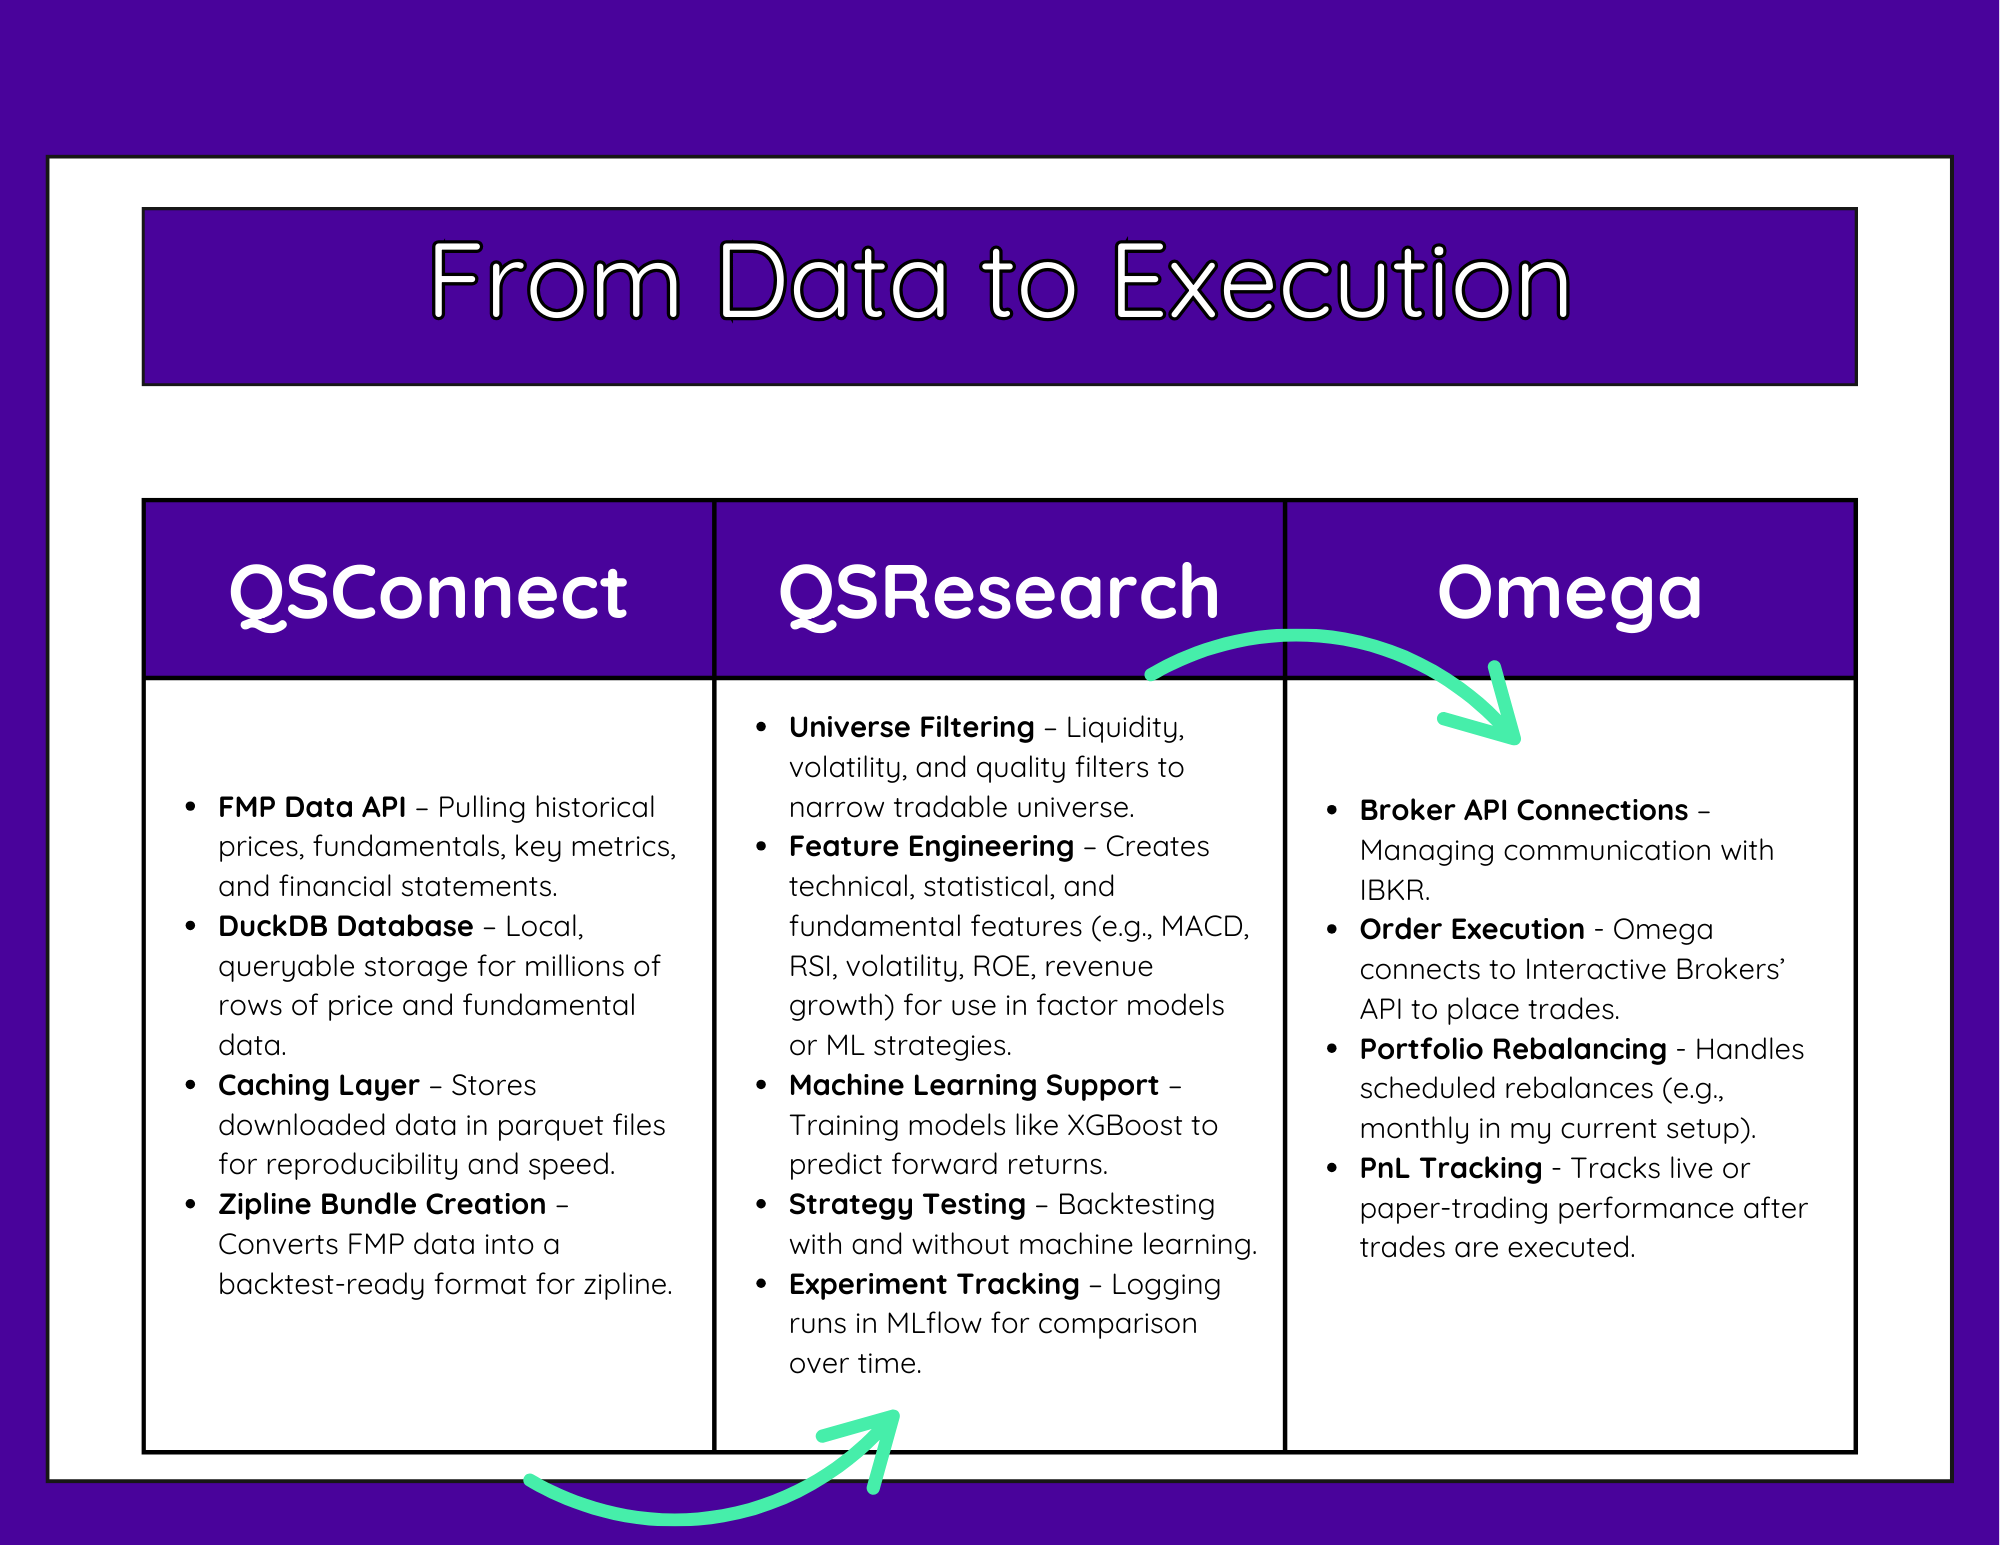
From Data to Execution diagram showing QSConnect (FMP/DuckDB ingest), QSResearch (feature engineering & MLflow backtests), and Omega (IBKR execution, rebalancing, P&L).
Attend the Next Special Training Event
In this webinar, you’ll hear all about what it takes to manage and start working with an end-to-end algo trading pipeline.

What: Algorithmic Trading for Data Scientists
How It Will Help You: Learn how the Quant Science course would teach you how to build, backtest, and track systematic trading strategies using tools like Python, Zipline, and MLflow, so you can confidently experiment, refine, and grow as a trader.
Price: Free
How To Join: Register Here
Getting and Managing a Larger Dataset with FMP
In Level 2, data access scales up. Instead of small hand-picked samples, I’m screening across thousands of stocks. This gives me:
Historical prices
Fundamental data (book value, P/E ratios, etc.)
Financial statement metrics for factor modeling
And of course, you’ll have your ETF benchmarks to compare against
The first task is setting up qsconnect to pull FMP data into a DuckDB database. This matters because:
You can store years of historical data locally
Queries are fast (DuckDB is optimized for analytics)
You avoid API throttling by working from your own database
It’s the first time I’ve had such a clean, flexible setup for pulling and storing this much data for personal use, regardless of what type of data project I’m working on. qsconnect handles data ingestion, caching, and access. For example, we might pull all stocks above a certain market cap and average volume, and then create a zipline bundle that can be reused as we test various strategies..
The big thing for me was having a system. For years, when I’ve tried my hand at algorithmic trading, there were an overwhelming number of libraries, and I come from a non-finance background. I was very unsure of my needs and what packages I should be considering (or not considering). Since much of the content online is sponsored, and you’re often not seeing an end-to-end pipeline, I couldn’t get an idea of the big picture that would allow me to put everything together in a way that would allow me to feel confident.
Combining Value and Momentum Factors with qsresearch
This was easily my favorite part of Level 2.
In Level 1, momentum was the clear winner among the three strategies during my testing. (More about Level 1 is in a previous article here.) In Level 2, we don’t just run momentum on its own, we combine it with value features and other fundamentals, then we use XGBoost to build a predictive factor model.
Instead of a simple two-factor rank, the pipeline in this clinic pulls together:
Technical momentum
Fundamental strength
Specialty growth-value blends
The workflow looks like this:
Preprocess price data from our FMP database and add technical indicators.
Join fundamentals from multiple FMP tables.
Screen the universe with liquidity, volatility, and quality filters.
Engineer composite factors
Train XGBoost on historical data to predict which stocks are most likely to outperform for various look-forward periods.
Construct the portfolio for analysis
Running this hybrid model in backtests produced a noticeably different risk/return profile than pure momentum. I had read the book “Quantitative Momentum” that was recommended during the course and learned about combining momentum and value strategies. In the course, they’re incorporating a momentum score from the book along with the momentum calculation they shared in Level 1. Basically, we’re using momentum’s ability to capture trends, paired with value and quality filters to avoid overpriced or fundamentally weak stocks. I’m sure I’ll investigate other strategies on my own later, but for now I plan on testing and iterating with this one.
Tracking Backtests with MLflow
I’ve already written an article about this, but one of the best time savers for comparison and analysis is that Level 2 utilizes MLflow in the backtesting process.
Every time you run a backtest, MLflow automatically logs:
The parameters used (factor lookbacks, universe size, etc.)
Key performance metrics (Sharpe, Sortino, max drawdown)
Strategy code version
Plots and analysis files
AlphaLens and Pyfolio tear sheets
This means I can go back months later and instantly compare against my previous runs and anything else I’ve tried along the way.
Without MLflow, I’d be digging through random folders and filenames trying to remember which run was which
Orchestrating and Deploying Strategies
The final session, Class 8, dives into advanced strategy orchestration and deployment. Essentially, this is the class where all the individual pieces we’ve been building come together into a cohesive, automated system. We covered how to run multiple strategies in parallel, go end-to-end through the pipeline, and keep everything production-ready.
I’m excited because this is the bridge between research mode and a real, running trading operation. I just watched this live class today and I am so excited to start playing with it. I’m hoping that I’ll be able to start spending less time on code (although, there was time necessary here to really learn the different pieces), and more time designing and backtesting new strategies. This is the part where my workflow shifts from just building to actively managing and iterating on a portfolio of models in a controlled, repeatable way.

Prefect workflow timeline showing FMP fundamentals/price downloads, a Zipline bundle build, and many parallel backtest runs.
My Thoughts So Far
Level 2 gave me what I was looking for: At the end of the course, I was ready to start backtesting and trading strategies with a system that I feel is rigorous. This is the most organized my trading research has ever been.
I’m still paper trading for now, but with these tools in place, I finally feel like I have the infrastructure to iterate intelligently and get further than before.
If you’re considering joining, my affiliate link below gets you $1,000 off the course.
Quant Science Program – $1,000 Off
To attend the next free live webinar to hear more about the course, you can do that here.
If you want to follow along with my future articles, join my email list. I’m currently only sending updates about algorithmic trading and this journey.
**The content in this article is for informational and educational purposes only. It is not intended as financial, investment, or trading advice. All strategies and opinions expressed are those of the author and do not constitute recommendations to buy, sell, or hold any financial instruments. Trading and investing involve risk, and you should conduct your own research or consult a qualified financial advisor before making any investment decisions. ** Hypothetical or simulated performance results have inherent limitations and do not represent actual trading. No representation is being made that any account will or is likely to achieve profits or losses similar to those shown. Quant Science is not a registered investment adviser or commodity trading advisor, and nothing herein should be construed as personalized advice. **