Why You Should Be Using MLflow to Track Backtests for Algo Trading (Even Without Machine Learning)
** Disclosure: This post contains affiliate links. As an affiliate of Quant Science, I may receive a commission if you sign up or make a purchase using my links, at no additional cost to you. All opinions expressed are my own and based on my personal experience. **
** Quant Science is not a registered investment adviser under the Investment Advisers Act or a commodity trading advisor under the Commodity Exchange Act. The information provided is for educational and informational purposes only and does not constitute investment, financial, or trading advice. **
As a data scientist, I’ve spent a lot of time working on machine learning models, and I’ve used tools like MLflow to track hyperparameters, performance metrics, and experiment versions so that I can compare runs and stay organized. I’ve even co-authored a book on using MLOps when building LLM-powered apps using Comet (another experiment tracking tool), published with Wiley in 2024. I’m a bigger fan of experiment tracking than many. But what we’re doing in the Quant Science course opened my eyes to another extra exciting use of experiment tracking: backtesting trading strategies.
Machine learning strategies for trading are covered in the Quant Science course, but we’re tracking our runs even when testing a strategy that does not involve machine learning.
Quant Trading Is One Giant Experiment
When you’re building systematic trading strategies, whether momentum, risk parity, or any other, every change you make is a hypothesis that you’re testing. And I couldn’t imagine keeping track of this without a tracking tool. Think about all of the potential variations:
Switch your universe from tech stocks to value stocks?
Adjusting your long/short thresholds (e.g., top 10% vs top 20%)
Test adding a stop-loss or trailing stop to your positions
Apply z-score normalization to your factor
Add a second factor (e.g., combine momentum with value features)
Each tweak is an opportunity to compare performance. And unless you have a reliable way to track and compare results, it’s really easy to:
Lose track of what you’ve already tried
Forget which past runs performed well
Waste time making comparisons when the data could’ve been at your fingertips
This is exactly why Quant Science is using MLflow, even for the non- machine learning strategies.
Attend the Next Quant Science Webinar
In this webinar, you’ll hear all about what it takes to manage and start working with an end-to-end algo trading pipeline.
What: Algorithmic Trading for Data Scientists
How It Will Help You: Learn how the Quant Science course would teach you how to build, backtest, and track systematic trading strategies using tools like Python, Zipline, and MLflow, so you can confidently experiment, refine, and grow as a trader.
Price: Free
How
To Join: Register Here
So, How Are We Using MLflow?
After running a strategy, I’m looking at the performance of this strategy compared to a benchmark, and I’m comparing it to previous strategies that I’ve tried. Matt Dancho built this out so that all of the parameters and tear sheet output are stored, and MLFlow logs and keeps track of the output.
Although I love the tear sheets from AlphaLens and Pyfolio, they don’t give me the ability to look across runs. For each backtest, Matt set up MLflow to track a rich set of performance metrics that actually help me decide whether a strategy is viable (and better than previous runs):
Total Return
CAGR (Compounded Annual Growth Rate)
Sharpe, Sortino, and Calmar Ratios
Max Drawdown and Average Drawdown
Win Rate by Year or Rolling Period
Twelve-month return and volatility
Best and worst day/month/year performance
We’re also logging the exact configuration of the strategy:
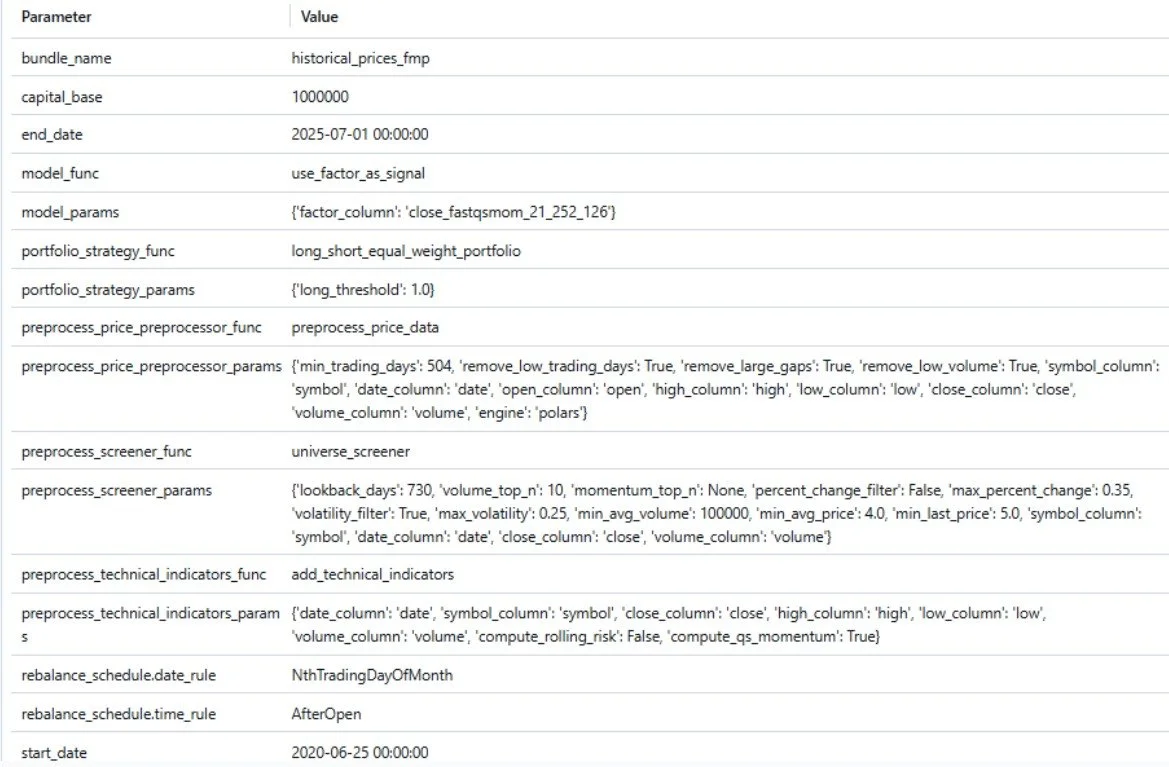
The momentum lookback windows (e.g., 21, 252, 126)
Universe filters (e.g., min market cap, price > $10)
Whether the strategy includes short positions
Rebalance frequency
Portfolio construction method
Quant Science built their QSResearch library with a configuration-first approach, meaning that nearly every parameter for the backtest, from rebalance frequency to factor lookbacks, to universe filters, is specified in a single CONFIG dictionary.
That setup makes it really easy for MLflow to automatically log every parameter in a structured way. So even when I'm not using a machine learning model, MLflow still captures all the relevant strategy inputs.
This view in MLflow shows the parameters that were passed into my backtest config. Everything from the bundle I used, the starting capital for the backtest, the rebalance schedule, and the exact filters and settings for screening, preprocessing, and factor construction. It’s all captured automatically:
Next, is one of my favorite parts. The MLflow dashboard shows a side-by-side comparison of all my recent backtest runs. I can instantly compare by metrics like Sharpe ratio, drawdown, or monthly return to see which versions of the strategy performed best. It makes it super easy to spot what’s working, what’s not, and which run is worth digging deeper into. It’s easy to get visibility into every experiment.
These aren’t great strategies, I’ve just started, and some of them have high drawdowns, but that’s the point of tracking. I can quickly compare results, spot tradeoffs, and iterate toward better performance. This dashboard makes my strategy development feel like an actual research process.
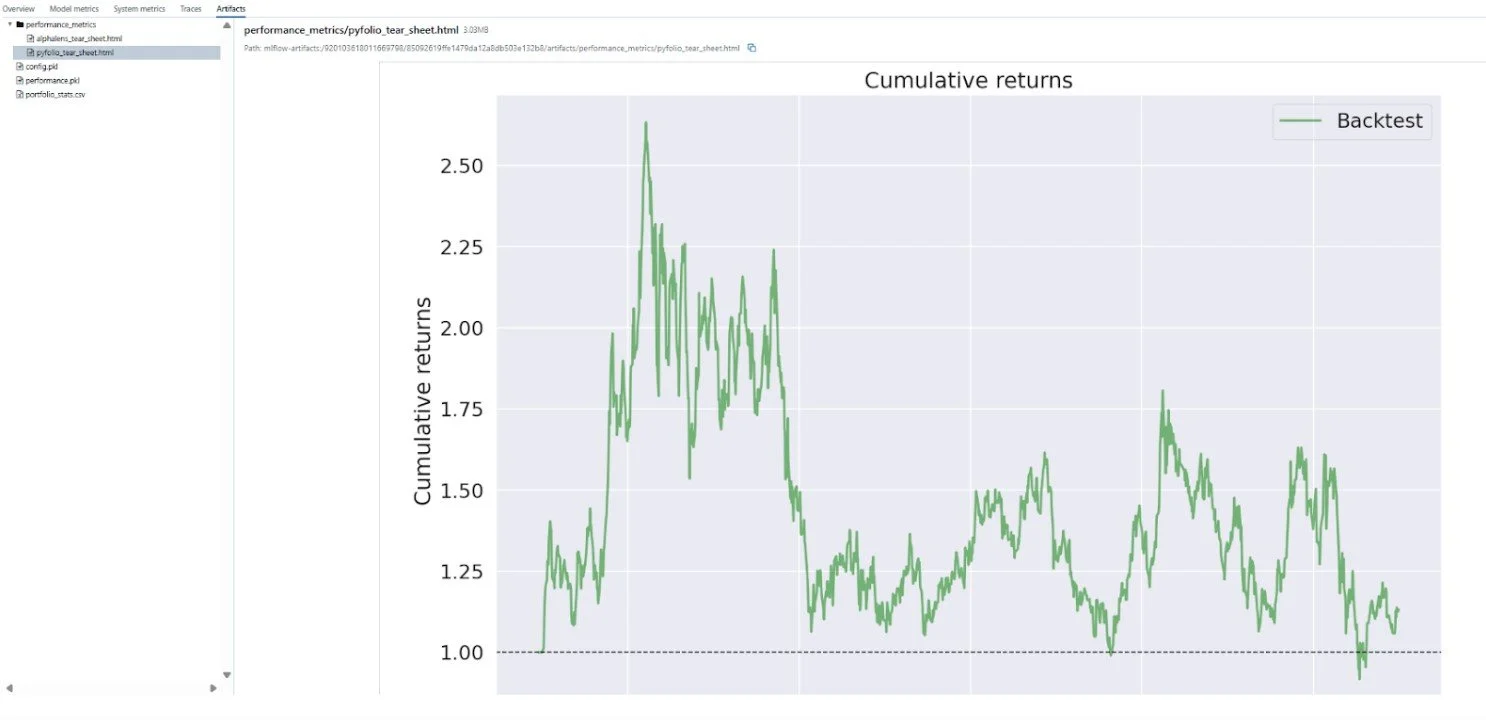
I can dig deep into the performance compared to a benchmark. Here, the benchmark is AAPL, so my portfolio got crushed, but at least I’m not trying to oversell myself over here.
The AlphaLens and Pyfolio tearsheets are easy to find, and they’re not in some poorly named file on my desktop, they’re stored with the experiment run.
Aphalens:
Pyfolio:
And all of this is tracked automatically. I’m not an organized person by nature. I’m not the type of person who is going to save all of my AlphaLens tear sheets in a neat folder with a naming convention that gives me useful context. But now I don’t need to! It’s all right here. The experiments are also persistent in MLFlow. I can access them even if my local output files get deleted.
How It’s Different from ML Tracking
Historically, I’ve always used experiment tracking to store the model type, hyperparameters, and training/validation accuracy metrics. Instead, we’re treating the backtest as the experiment, and storing all of the associated metrics with a given look-forward period, and comparing to a benchmark.
It's the same principle, but applied to a domain where reproducibility, auditability, and comparison are just as important.
It Makes Me Smarter, Faster
MLflow has become my second brain in this process.
Instead of:
“Wait, didn’t I already test that?”
I can just look it up.
Instead of:
“That strategy looked promising, but I can’t remember what threshold I used.”
I have it logged.
I can focus on analyzing the data, rather than trying to aggregate it. I might’ve felt overwhelmed (or missed important pieces) otherwise.
Final Thoughts
Honestly, I’m having a ridiculous amount of fun with this.
I came into the Quant Science program with a strong data background, but this kind of structured experimentation with financial strategies instead of machine learning models is just so satisfying. It feels like a playground for data nerds, but with actual portfolio implications. This week, I will be spending a lot of time backtesting with ML, but I wanted to share that I’m enjoying experiment tracking even without it.
What I love most is how this whole setup takes away the busywork. I’m not manually screenshotting backtests or trying to remember which CSV matched which strategy. It’s all being logged for me, and that lets me focus more on the strategy.
There’s so much more to test, compare, and analyze.
If you’re curious about the Quant Science program, check out their next webinar here.
**The content in this article is for informational and educational purposes only. It is not intended as financial, investment, or trading advice. All strategies and opinions expressed are those of the author and do not constitute recommendations to buy, sell, or hold any financial instruments. Trading and investing involve risk, and you should conduct your own research or consult a qualified financial advisor before making any investment decisions. ** Hypothetical or simulated performance results have inherent limitations and do not represent actual trading. No representation is being made that any account will or is likely to achieve profits or losses similar to those shown. Quant Science is not a registered investment adviser or commodity trading advisor, and nothing herein should be construed as personalized advice. **


