
How Do Earnings Events Impact a Momentum Strategy? A Backtest Across Two XGBoost Models
Disclaimer: Quant Science is not a registered investment adviser under the Investment Advisers Act or a commodity trading advisor under the Commodity Exchange Act. The information provided is for educational and informational purposes only and does not constitute investment, financial, or trading advice.
Disclosure: This post contains affiliate links. I am an affiliate for Quant Science and may receive a commission if you sign up or make a purchase using my links. I’d appreciate it if you used them—there’s no additional cost to you, and in some cases it may even give you a discount. All opinions are my own and based on my personal experience with the course and tools.
There's something deeply satisfying about fitting models, it hasn’t gotten old over my whole career. And when it’s for improving a momentum trading strategy, it's entirely for my own benefit, even better. I notice something, build a feature, and test it. No stakeholders, no sprint tickets, just curiosity and machine learning.
This month, I held CRDO through the June 1st rebalance, completely unaware they had earnings on June 1st after close.
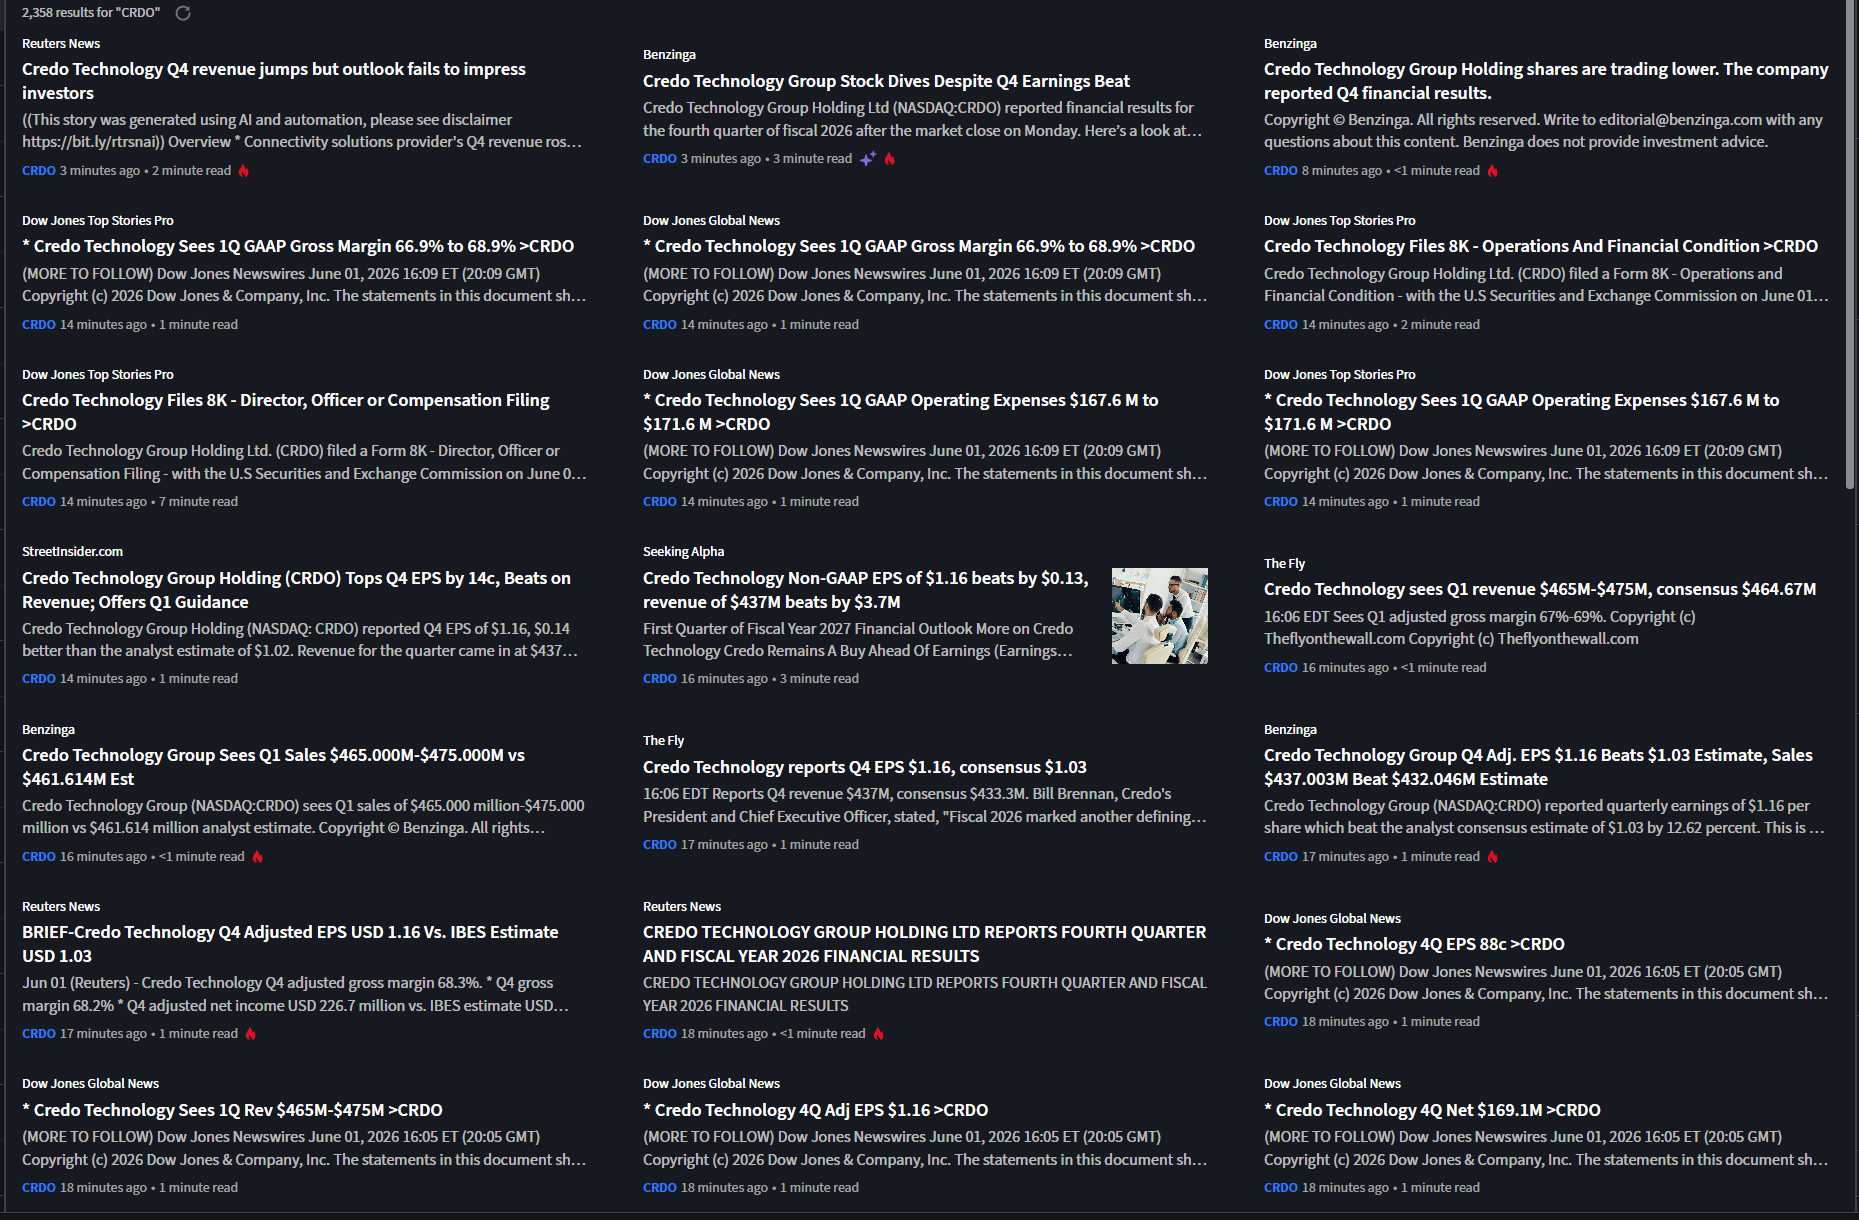
CRDO beat on EPS, beat on revenue, things looked positive, and I still lost half my daily P&L in the aftermarket session. A company can beat earnings and still sell off if expectations were higher. Then on June 4th, CIEN did the same. Although CRDO turned around right after (CIEN just happened), I was interested in how my models would respond to pricing information.
Since my holding period is roughly one month, earnings events are guaranteed to land inside that window. By the time I buy a stock, some of the anticipated earnings move may already be priced in. The strategy is not just exposed to momentum risk; it is exposed to earnings gap risk as well - good or bad.
I am not claiming this speaks for all momentum models, but for my two XGBoost momentum models, I wanted to dive in.
This article walks through exactly how I tested it:
The Two Momentum Models I Run (And Why They Find Different Stocks)
Setting up the Test
What Happened When I Ran the Backtest
Takeaways
The Two Momentum Models I Run
The first model targets 10‑day forward returns (even though it rebalances monthly). It leans more heavily into fundamentals, FCF growth, revenue momentum, ROE, and other growth‑oriented factors. It often finds stocks earlier in the trend lifecycle: companies emerging from corrections, accelerating fundamentals, or situations where momentum is beginning to reassert itself. These names can be explosive when the thesis is right, but the drawdown is higher. This model contributed a 29% drawdown and recovery during the Iran conflict, which ultimately pushed me to build the second model.
The second model targets 21‑day forward returns. It focuses more on momentum quality, trend consistency, and smoother price action, with features like FIP scores, momentum‑quality measures, and longer‑term trend characteristics. The stocks it finds are often less dramatic but more stable.
The growth momentum model is now 30% of my active capital and the less spicy trend momentum model is 70%. Both models are still spicy, so I am scaling slowly while simultaneously living on the edge.
Setting Up the Test
The first thing I needed was a clean earnings calendar going back to 2000. I pulled it from the Financial Modeling Prep API, symbol by symbol, for my full universe of roughly 7,600 tickers. I stored everything in DuckDB alongside my price and fundamentals data.
Coverage was 81.8% of my price universe. Not perfect, but as long as coverage is stable across time and predictive, that’s good enough for me.
Backtest was run from 2015 to present, walk forward, and rebalances monthly. Each month 10 positions are chosen, long only.
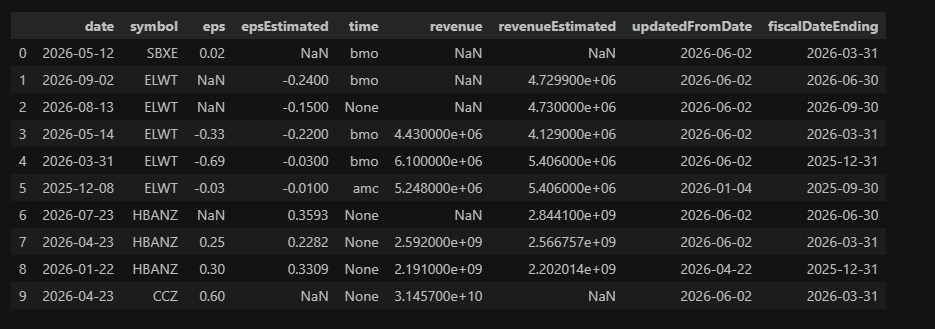
The table below is what is returned from FMP for earnings data. I’m only using the information to create a binary flag for whether an earnings event will happen during the month I’m holding the symbol. Then I use the column as a factor in the model or a hard filter.
Implementation‑wise, the pattern is straightforward: a preprocessing step that joins the earnings calendar to the universe by symbol and date, checks whether any earnings date falls within 21 days of the trading date, and either returns a filtered universe or adds an earnings‑proximity flag to the dataset for the model to use as a feature. In my pipeline, it slots in like any other feature‑engineering function, which makes it easy to flip between the baseline, hard‑filter, and feature‑flag variants with the same backtest configuration.
Setting up this experiment took an afternoon because the infrastructure was already built. The data pipelines, feature engineering framework, and backtesting environment came from the Quant Science courses.
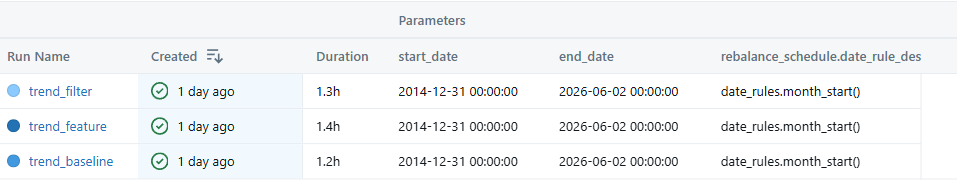
I’m running 6 backtest configurations in total: a baseline for each of my 2 models, plus two earnings-aware variants for each one. Conceptually, it’s two “control vs. 2 treatments” variants for each.
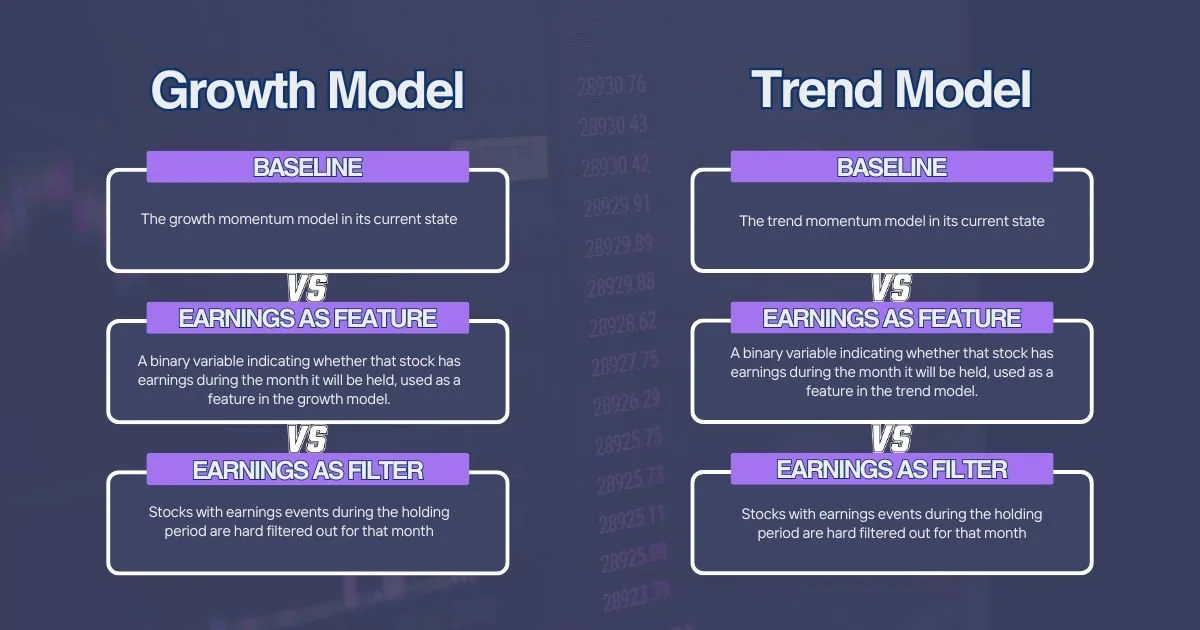
The diagram above shows how the six configurations line up across the two models. In prose, here’s what each variant does:
Baseline: No earnings information
Both models run exactly as they do today, with no awareness of upcoming earnings. This is the reference configuration I use to judge whether adding earnings as a filter or a feature is actually worth it.Variant 1: Earnings feature flag
Instead of filtering, I add a binary feature has_earnings_in_window and let XGBoost decide what to do with it. If earnings proximity is consistently bad, the model can learn to downweight those names. If it’s consistently “good” (think pre-earnings drift) or depends on other features, the model can capture that.Variant 2: Hard earnings filter
Any symbol with an earnings event within the next 21 days (my approximate holding period) is removed from the investable universe. If earnings proximity is mostly uncompensated gap risk, this should improve drawdowns and risk-adjusted returns, especially for the higher-volatility model.
What I Found
For the Trend Momentum model, both earnings-aware variants clearly underperformed the baseline. Whether earnings was added as a feature or used as a hard filter, the long-term equity curve was weaker than simply ignoring earnings entirely. Suggesting that removing earnings exposure may also remove some of the very events that help momentum stocks continue moving.
The Growth Momentum model told a different story. While the baseline still produced the highest overall return, the earnings feature variant remained surprisingly competitive. The COVID drawdown was much smaller with earnings included and the curves moved more closely together.
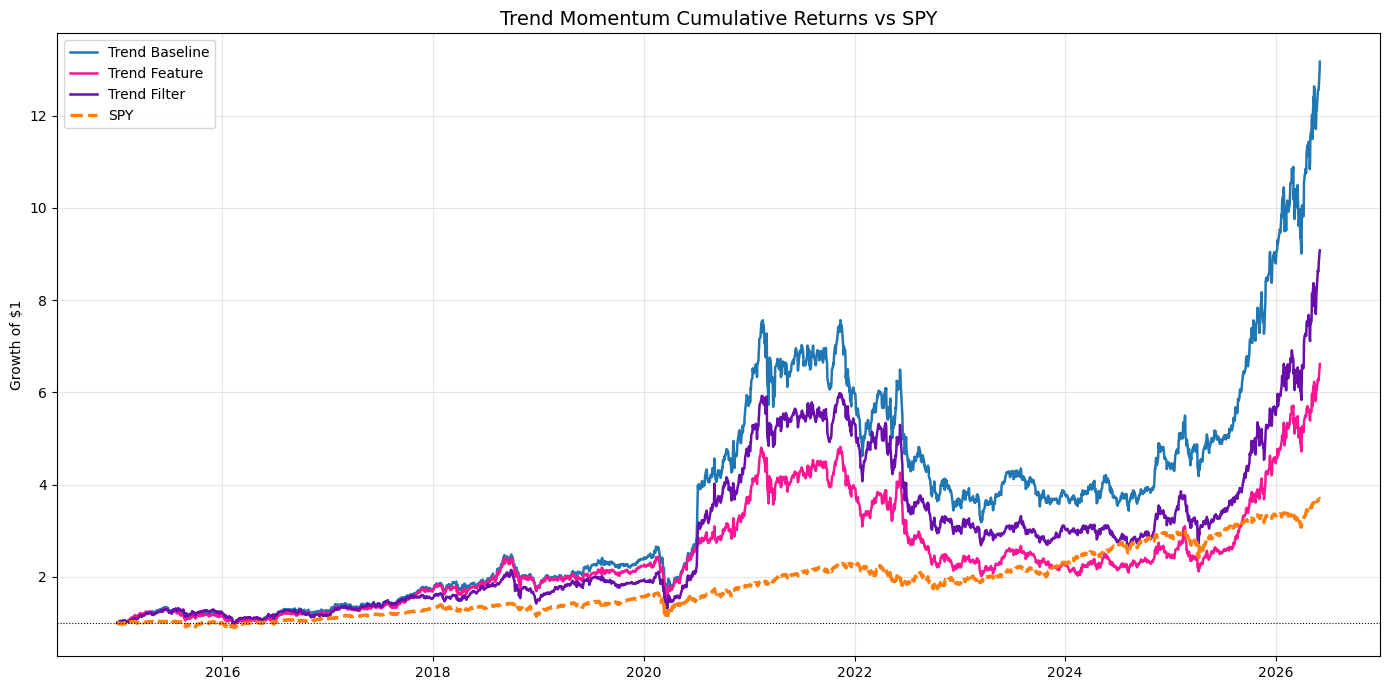
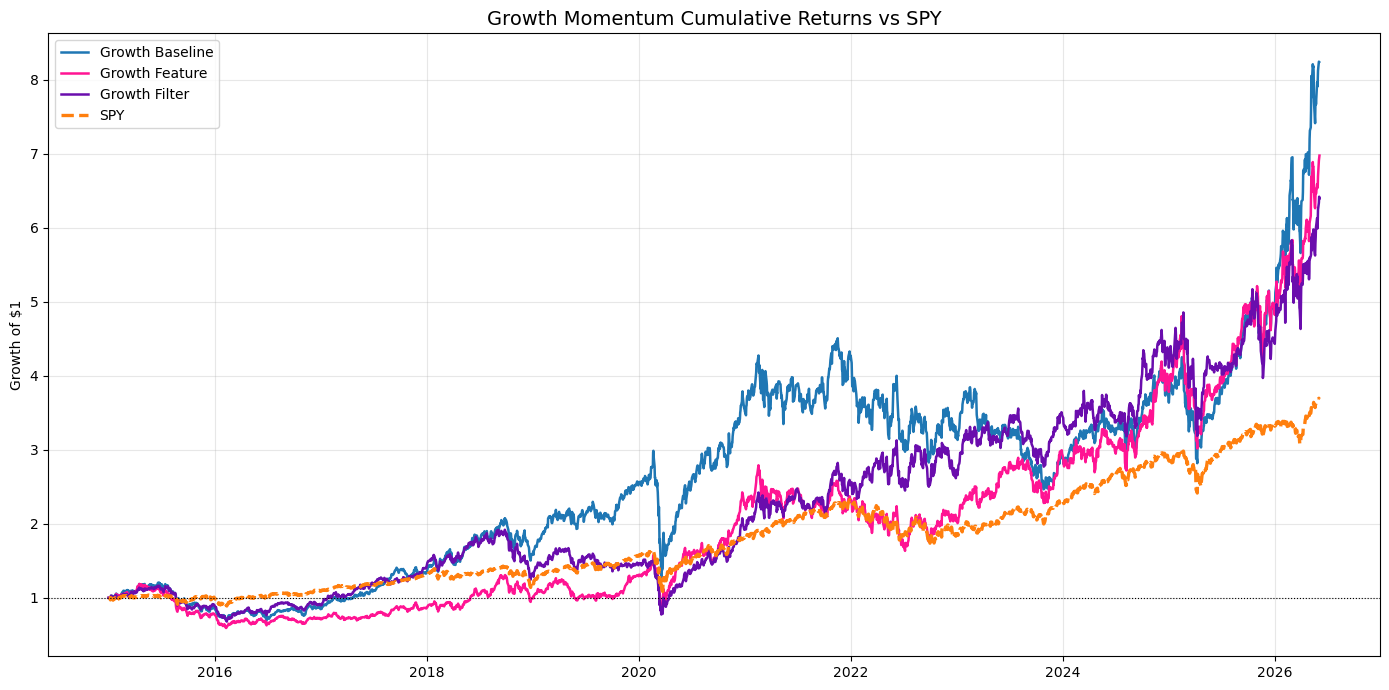
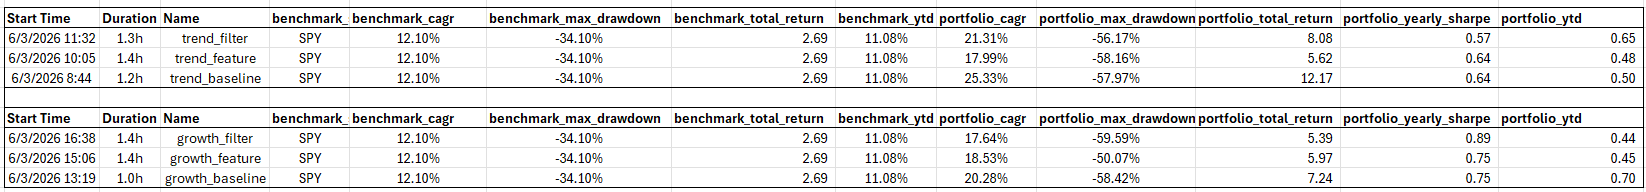
The headline results were consistent across both models. The baseline model for both trend and growth momentum models had the highest CAGR (trend 25.3% and growth 20.2% CAGR).
In the growth model, the feature version won on drawdown (-50%) and in the trend model the filtered version had the smallest drawdown (-56%). Yes, I know these are high.
The baseline wins on both models. The growth earnings feature drawdown looks much better, but I’ll be moving forward with both baselines and treat one earnings‑aware variant as “research‑candidate” rather than production. Before I move on, I want to look at the feature importance and SHAP results.
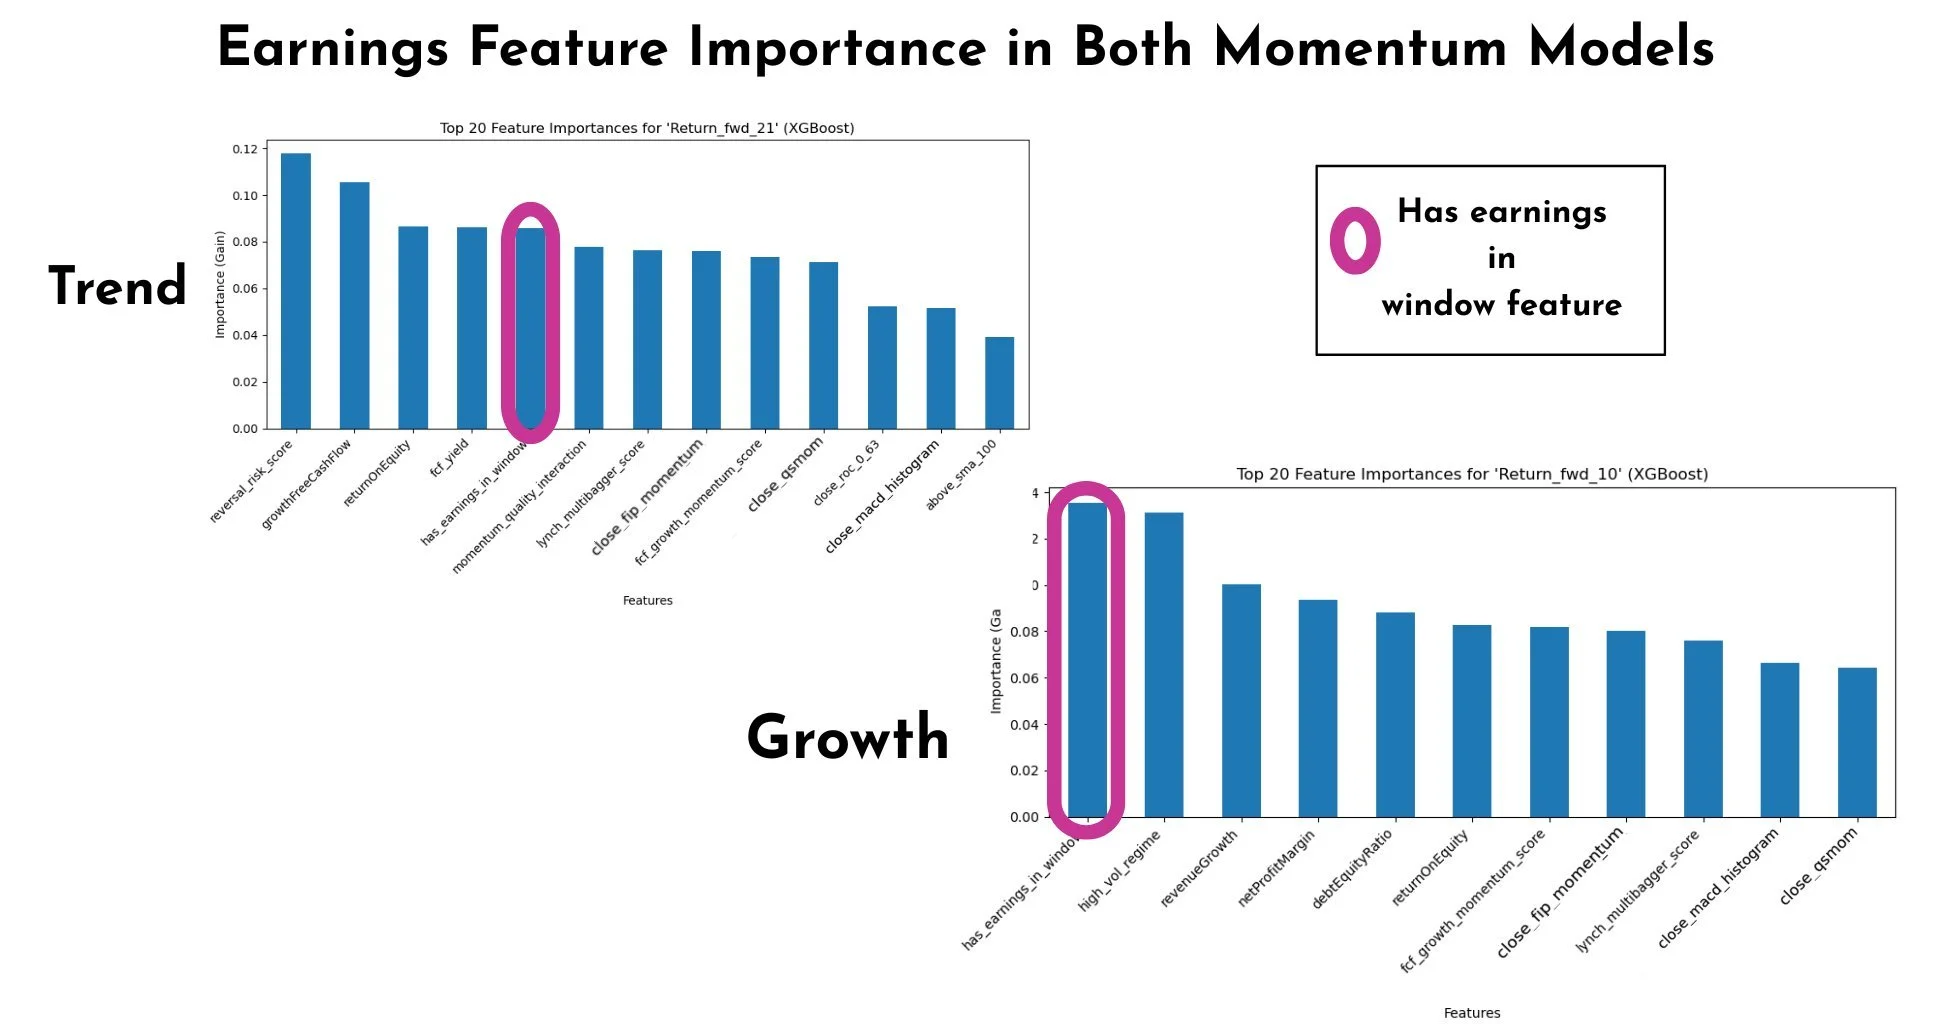
In the growth momentum model, the earnings feature came out as the single most important feature by XGBoost’s gain metric, ahead of my usual price momentum and fundamental factors. In the trend model it was slightly less dominant, but still sat in the top tier of features. Combined with the SHAP plots for CRDO (below), this makes the backtest results much easier to interpret: the models are actively using earnings proximity as a positive input, not treating it as noise or a landmine. That’s likely why the hard filters underperform, cutting all the earnings exposure (filter) removes signals the model might be relying on to find trades.
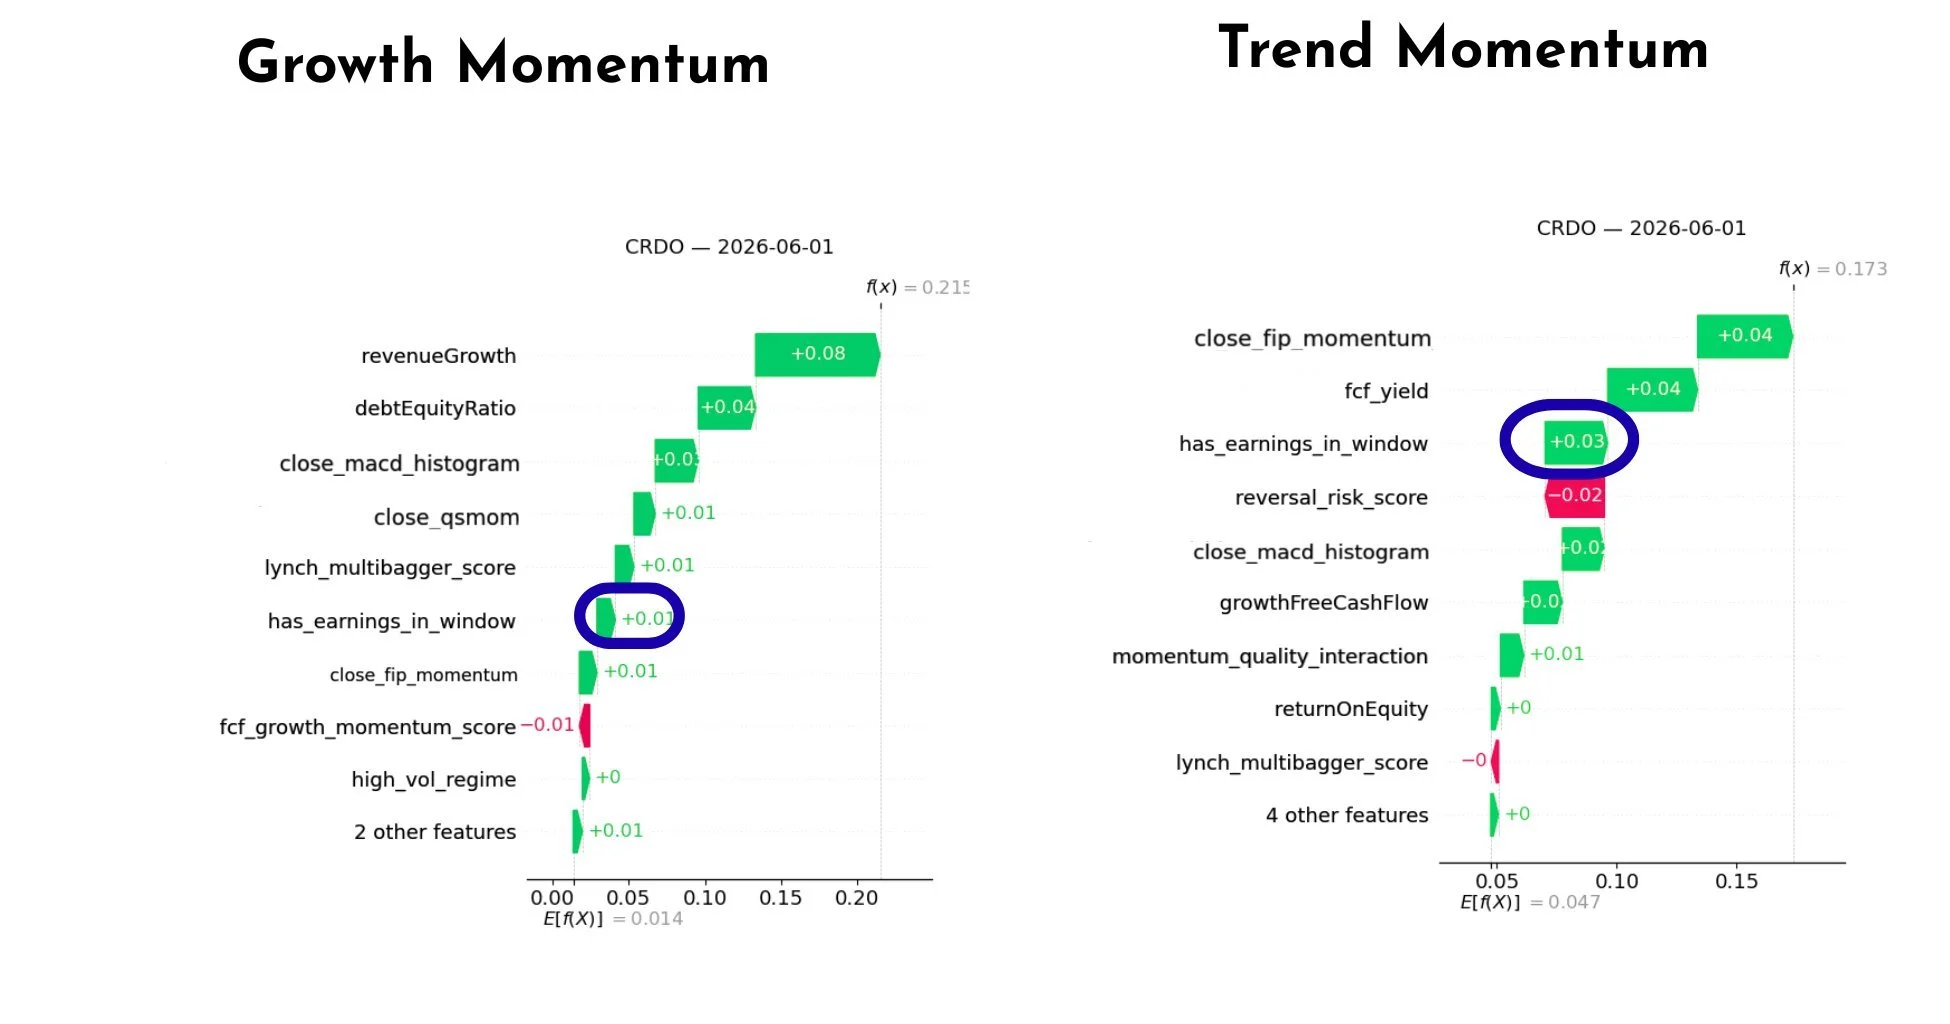
We see that there is a positive effect of having CRDO’s (the stock that originally motivated this experiment) earnings event when looking at SHAP. Both models viewed the upcoming earnings event as a positive signal. In the Growth Momentum model, the earnings feature provided a modest positive contribution. In the Trend Momentum model, the contribution was even larger, making earnings one of the more influential drivers of the prediction. The models were not treating earnings as a risk to avoid.
The Takeaway
For these two momentum models, earnings proximity turned out to be more of a signal to learn from than a risk to scrub out or a feature to include in the production model. The hard filter did reduce gap risk, but it also removed many of the very moves that drive momentum‑style returns over time. In this setup, the earnings flag works better as information the model can decide to use than as a blanket rule I impose by hand.
What am I testing next? I am going to focus on other strategies instead of continuing to tweak this one. I want to trade these versions for a couple of months, get to a place where I feel comfortable adding more capital, and avoid chasing tiny improvements.
If you want to build the infrastructure to run experiments like this yourself, I recommend the Quant Science courses. Here is a link to their next webinar.